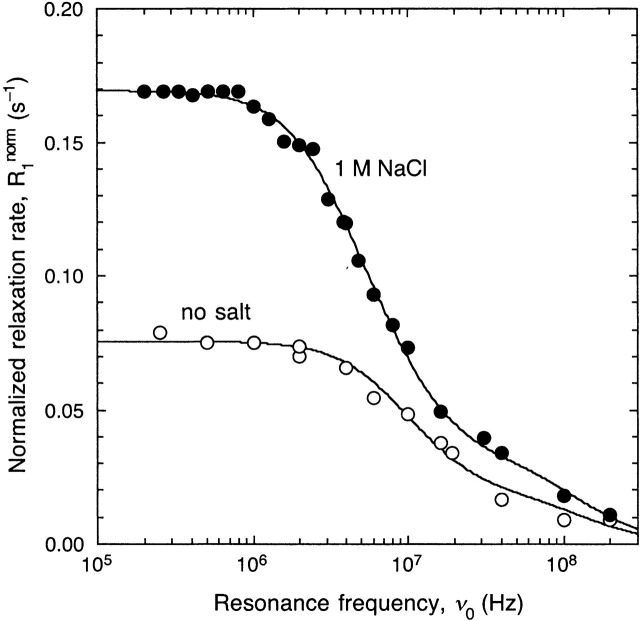
Figure 2.
1H relaxation dispersion profiles from aqueous BLG solutions at pH 2.5 (no buffer) and 27°C without added salt and in the presence of 1 M NaCl. The data have been normalized to 1.00 mM BLG. The dispersion curves resulted from a joint fit according to equations 1 and 2 with N = 2 and frozen correlation times (see text).

