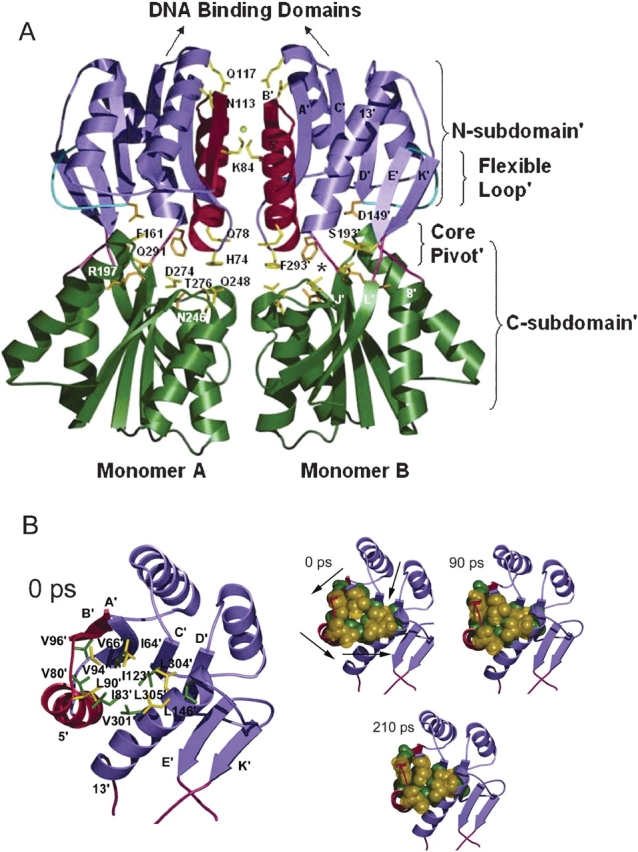
Figure 1.

(A) Backbone representation of the core domains of LacI dimer in the repressed form (PDB code 1EFA; Bell and Lewis 2000). N-subdomains are in purple; C-subdomains, in green; N-subdomain monomer–monomer interface, in red; flexible loops, in cyan; and interconnecting strands of the core pivot, in pink. Side chains of key residues in the simulation are highlighted in yellow; those that contact inducer are in orange. The chloride anion is represented by a yellow ball. The asterisk locates one of the inducer-binding pockets. The figure was made by using Molscript (Kraulis 1991) and rendered by Povray (www.povray.org). (B) Top views of trigger monomer, illustrating the N-subdomain’ hydrophobic group changes. Time intervals are listed on the top left corner of each structure. In larger representation on the left, residues involved are labeled and indicated with a stick representation. The three smaller figures on the right show the same residues in space-filling representation as they change positions over the course of the simulation. Arrows illustrate direction of movement of each region during the simulation. Counterclockwise rotation about the N-subdomain’ hydrophobic group causes contraction in the center of this region.
