
Figure 2.
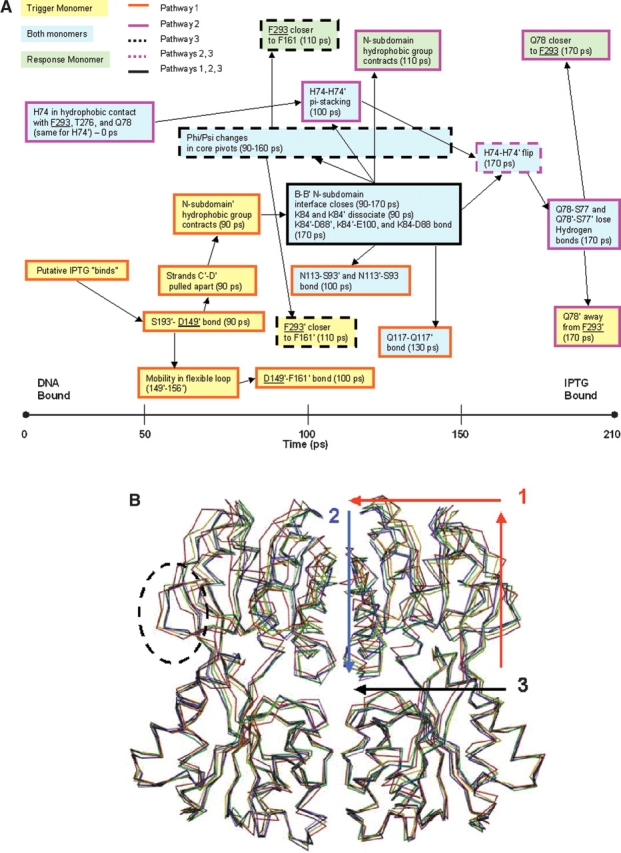
(A) Timeline of the allosteric transition pathway as simulated by TMD. Residues that contact inducer are underlined. Trigger monomer interactions are highlighted in yellow boxes; response monomer interactions, in green; and interactions involving both monomers, in blue. Boxes with dark orange borders are used to delineate pathway 1; pink borders, pathway 2; borders with black dotted lines, pathway 3; pink dotted lines, pathway 2/3; and a black border, involvement in all three pathways. (B) The structures of five representative time points along the simulated trajectory were aligned using the Cα residues of the stationary C-subdomains. The structures are colored as follows: red (0 psec), yellow (60 psec), green (110 psec), blue (160 psec), and purple (210 psec). The flexible loop (residues 149–156) is enclosed by a dotted circle. The directionality of pathway 1 is illustrated by the red arrows; pathway 2, by the blue arrow; and pathway 3, by the black arrow.