
Figure 7.
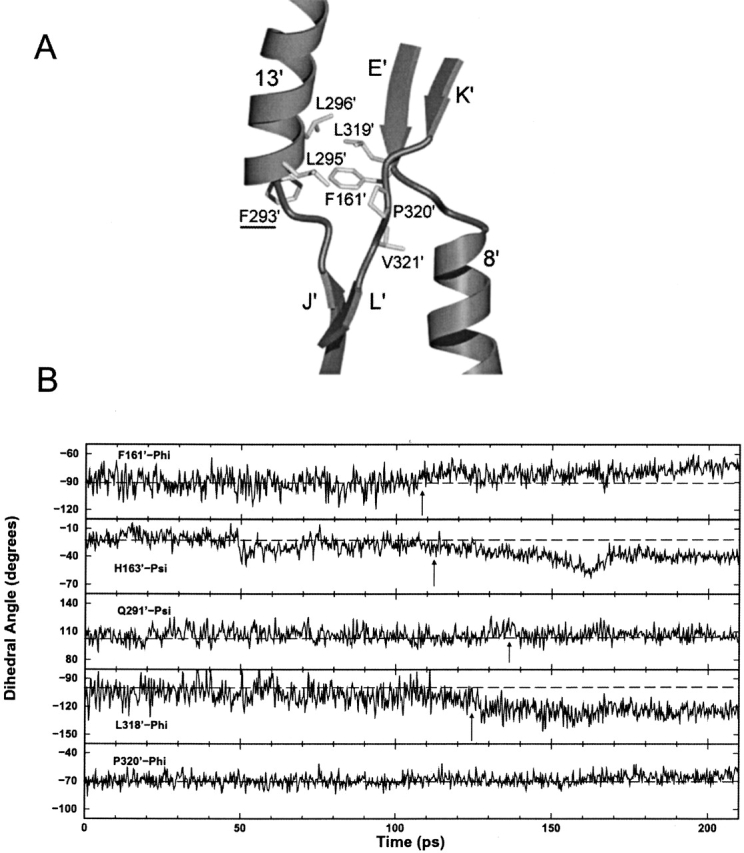
(A) Detailed view of the core pivot hydrophobic group in the trigger monomer. Interactions between residues are centered on F161’. (B) Backbone φ and ξ plots versus time for core pivot residues in trigger monomer. All residues plotted have standard deviations >9°, with the exception of P320’-Phi, which is displayed for comparison. Dotted lines indicate the approximate average angles at the start of the simulation. Arrows call attention to significant changes in φ/ξ angle.