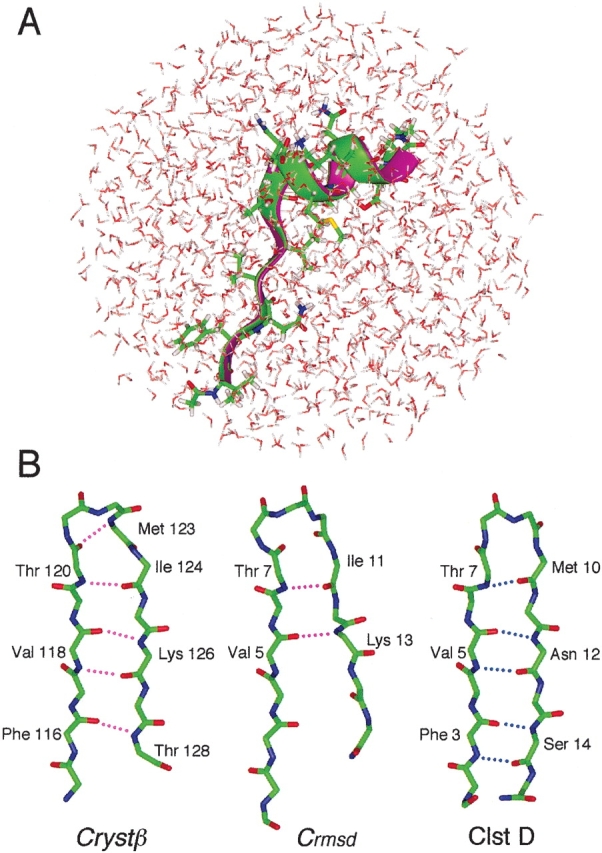
Figure 2.

Comparison of simulation conformations with Crystα or Crystβ. (A) Ribbon representation of a cluster-A conformation (green) and Crystα (magenta). Side chain of the cluster-A conformation is shown. Water molecules in simulation are also displayed to show how peptide is surrounded by water. (B) Main-chain conformations of Crystβ, Crmsd (the closest conformation to Crystβ in Ntv), and of cluster D. Broken lines indicate intra main-chain H-bonds involved in Crystβ (magenta) and in cluster-D conformation (blue).
