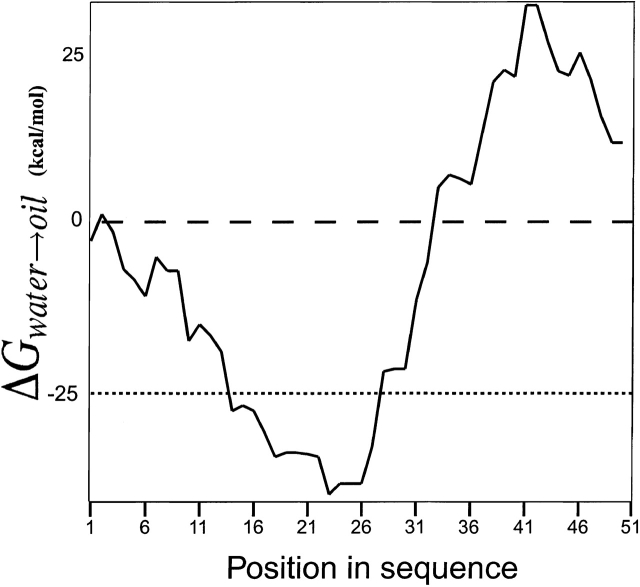
Figure 2.
Hydrophobicity analysis plot of the putative TM domains of SH protein, using GES scale (Engelman et al. 1986). The parameters used are a window size of 15 and the hydrophobicity threshold of ΔGwater→oil = −25 kcal/mole (Stevens and Arkin 2000), shown as a dotted line.

