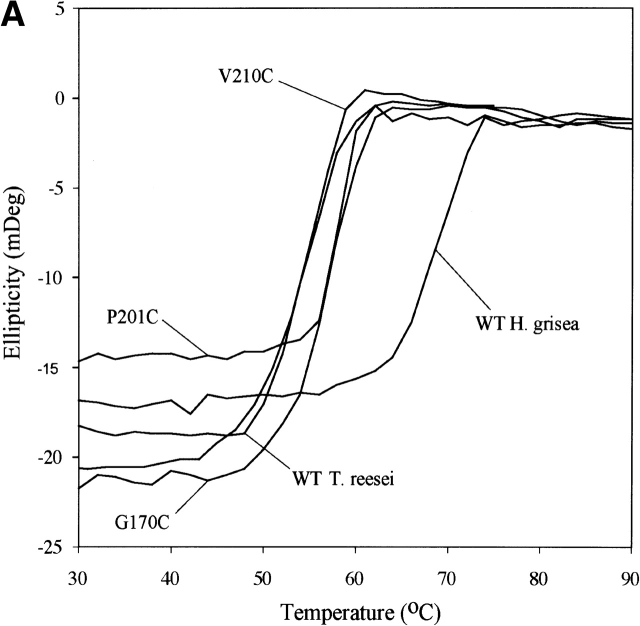
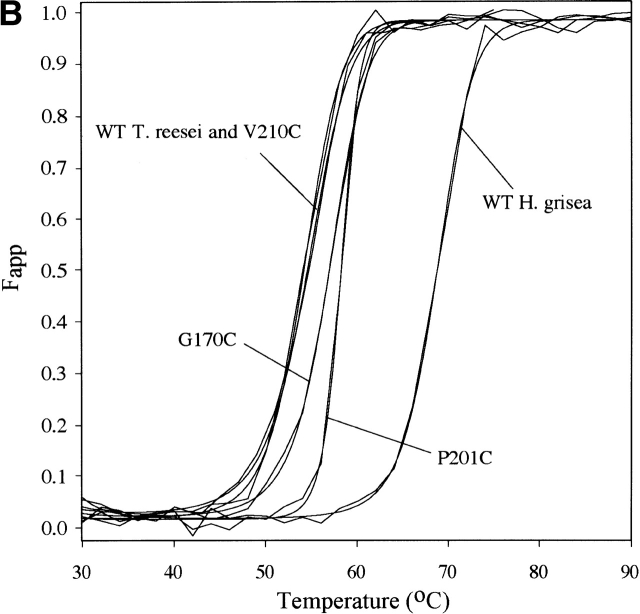
Figure 1.
The raw thermal denaturation data (A) are shown for a subset of proteins examined. These data and similar traces for all of the proteins listed in Table 1 were fitted to two-state models and used to produce a fraction apparent unfolded (Fapp) plot (B). By this convention, 0 represents native and 1 represents unfolded states for the protein. The protein concentration for all experiments was between 10 and 20 μM.


