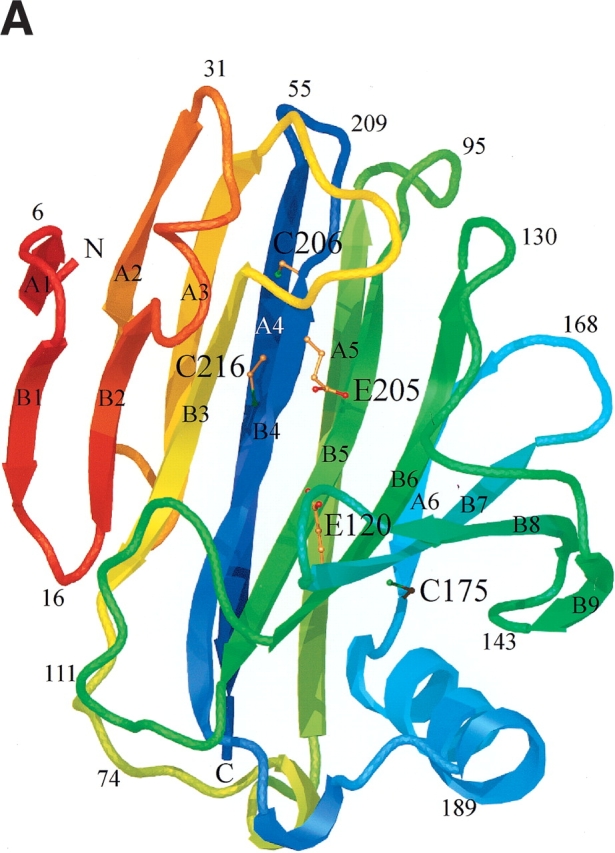
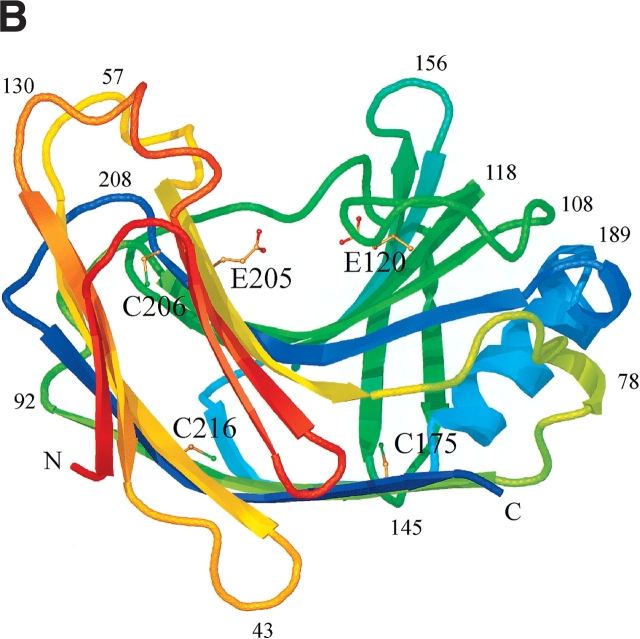
Figure 4.

Schematic ribbon diagram showing top (A) and side views (B) of the H. grisea Cel12A crystal structure, color-ramped according to residue number, starting with red at the N terminus and ending with blue at the C terminus of the structure. The structure has the expected fold of a GH family 12 enzyme. It consists mainly of 15 β-strands building up two β-sheets, A and B, A consisting of six β-strands and B of nine β-strands, that stack on top of one another revealing a β-sandwich. The individual β-strands are labeled (A1–A6 and B1–B9) according to their positions in the two β-sheets. The structure has side chains drawn for the three cysteine residues (C175, C206, and C216), and the two catalytic residues (E120 and E205). Figures 4 ▶, 6 ▶, and 7 ▶ were prepared using O (Jones et al. 1991), and rendered with Molray (Harris and Jones 2001).

