Figure 3.
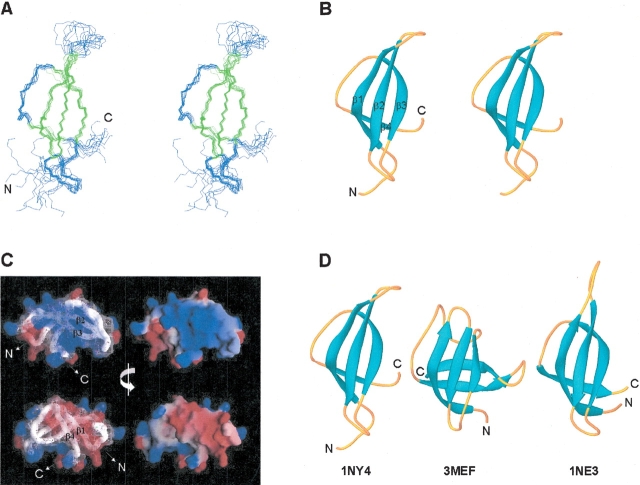
NMR solution structure of S28E determined using AutoStructure and DYANA. For the purposes of display, the disordered C-terminal segment and His-tag have been omitted, and only residues 1 through 60 are shown. (A) Stereoview showing the backbone atom superposition of 10 conformers representing the solution structure; β-strand elements are shown in green. (B) Stereoview of a ribbon representation of a representative conformer (lowest DYANA target function) from the ensemble. The four β-strands comprising the Greek-key motif are labeled. (C) Electrostatic potential surfaces (Nicholls et al. 1991) showing the “positive” (blue) and “negative” (red) faces of S28E. (D) Ribbon diagrams of representative models from the solution structures of P. horikoshii S28E (1NY4; residues 1 to 60), E. coli CspA (3MEF), and M. thermoautotrophicum S28E (1NE3; residues 1 to 58). The superpositions (A) were made using the program MOLMOL (Koradi et al. 1996) and ribbon diagrams (B and D), were generated by the program Ribbons (Carson 1991).

