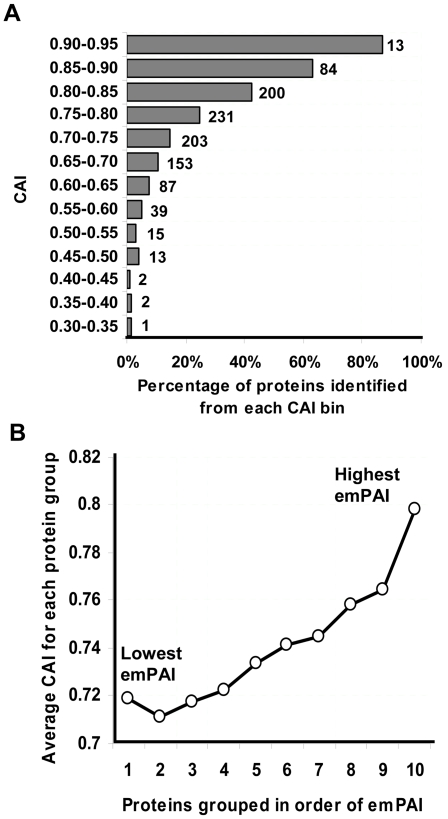
Figure 2. Relationship between CAI and protein identification or abundance.
(A) Percentage of proteins identified in various CAI ranges. Values beside the bars represent the absolute number of proteins identified from each bin (B) Average CAI of identified proteins in different abundance groups; values in horizontal axis correspond to protein abundance, “10” indicating the top 10 percentile (most abundant) to “1” indicating the bottom 10 percentile (least abundant) proteins. Protein abundance was estimated from MS data using emPAI based on number of MS/MS spectral evidences (refer to Materials and Methods)

