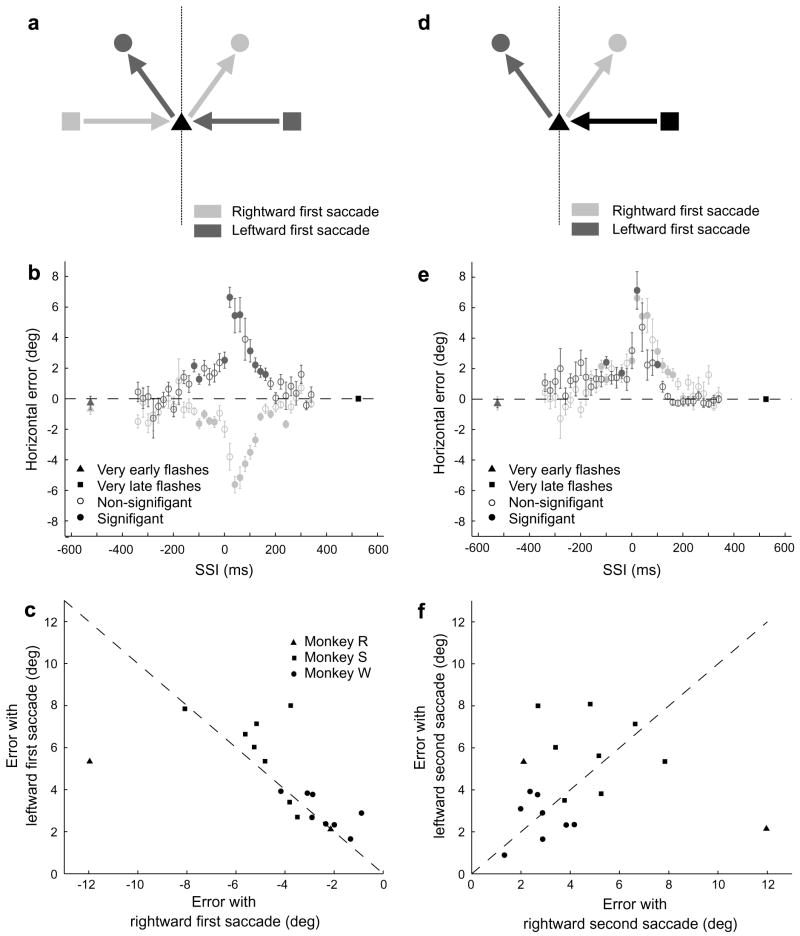
Fig. 3.
Comparison of error in trial types with symmetrical stimulus configurations. (a) Diagram of the spatial relationship between paired trial types. In trial types with a rightward first saccade (light grey), the animal makes an initial saccade from the FP1 location (square) on the left to FP2 (black triangle), and then to the target (circle), which in this example is on the upper right. Its symmetrical partner (dark grey) can be produced by reflecting the stimulus positions across the dotted vertical line. (b) Performance of one animal on two trial types paired in the manner diagrammed in a. Negative horizontal errors represent errors to the left. As in a, light grey represents a trial type with a rightward first saccade, and dark grey represents a trial type with a leftward first saccade. Note both the similarity in the magnitude of error and the overall symmetrical shape of the curves. (c) Plot of all pairs in all three animals. Most pairs are nearly equivalent in magnitude. In every case, the error is in the direction opposite the saccade (anti-directional). (d) Spatial relationship between trial types paired according to second saccade direction. In these pairings, the FP1 location was the same within a pair, but the target locations were symmetrical across the vertical midline. (e) Performance of one animal on two trial types paired in the manner diagrammed in a. Although the magnitude of error was similar for both members of this pair, that was not always the case. (f) Plot of all pairs in all three animals. There is no correlation of the magnitude of errors between pairs.

