
Fig. 6.
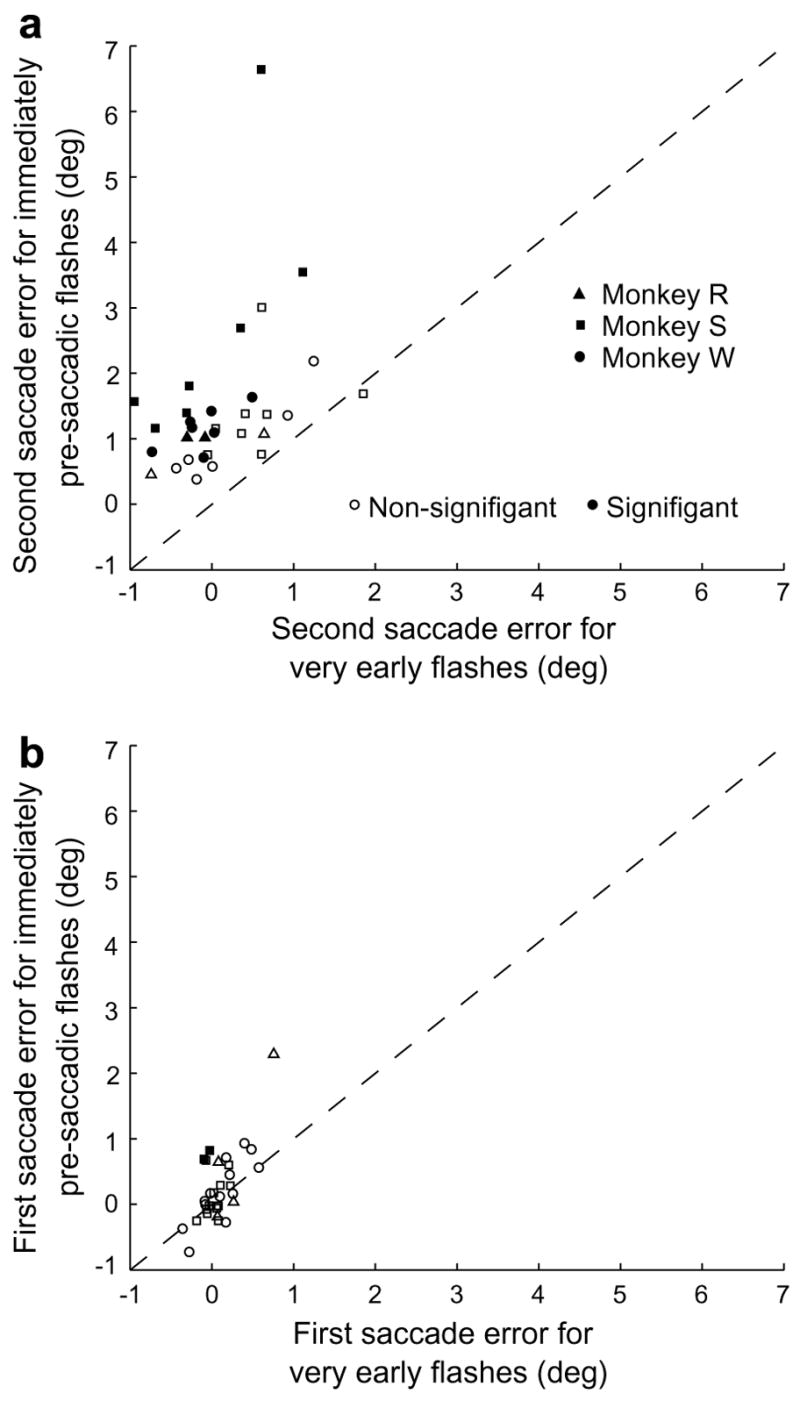
Anti-directional errors occurred for pre-saccadic target flashes. (a) Comparison of second saccade error in the immediate pre-saccadic period with that in trials with very early target flashes. The mean error in the immediate pre-saccadic period (SSIs −65 ms to −15 ms) is plotted against the mean error in trials with very early target flashes. Each data point represents a single animal’s performance on a single trial type, with thirty-two of the thirty-six trial types shown. Positive values represent errors in the direction opposite the first saccade. (b) Comparison of first saccade error in the immediate pre-saccadic period with that in trials with very early target flashes. Data points are from the same trial types as in panel a. Positive values represent hypometric first saccades.