Fig. 4.

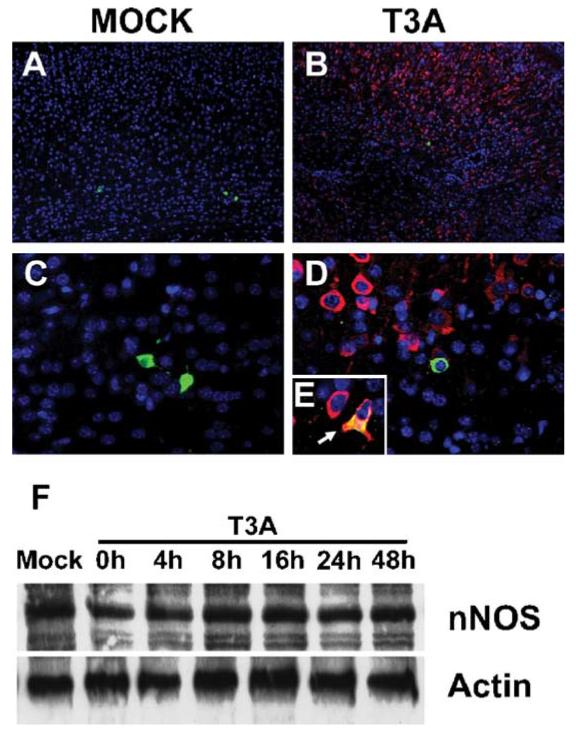
Expression of nNOS is unaltered in vivo and in vitro following T3A infection. Two-day-old Swiss Webster mice were mock infected (A, 40×; C, 400×) or inoculated i.c. with 1 × 10³ PFU of T3A (B, 40×; D, 400×;E, 630× oil immersion). At 8 days post-infection, brains were removed and immunohistochemical staining was performed to examine nNOS and reovirus co-localization. Dual-label immunofluorescence was used to examine nNOS (fluorescein-conjugated anti-rabbit secondary antibody) and reovirus (Texas red conjugated anti-mouse secondary antibody against reovirus α3-specific monoclonal antibody) localization. Representative images (n = 4) demonstrate nNOS and T3Aα3 localization in cingulate cortex of mock (A, 40×; C, 400×)- and T3A (B, 40×, D, 400; E, 630 oil)-infected brains. White arrow (E) indicates evidence of nNOS and T3Aσ3 co-localization. Protein levels of nNOS were assessed in primary neuronal cultures by Western blot analysis of whole cell lysates (F). Representative blot (n = 4) demonstrates nNOS levels in primary neuronal cultures between 0 and 48 h post-infection with T3A (MOI = 100). Actin levels were assessed as loading control.
