
FIG. 1.
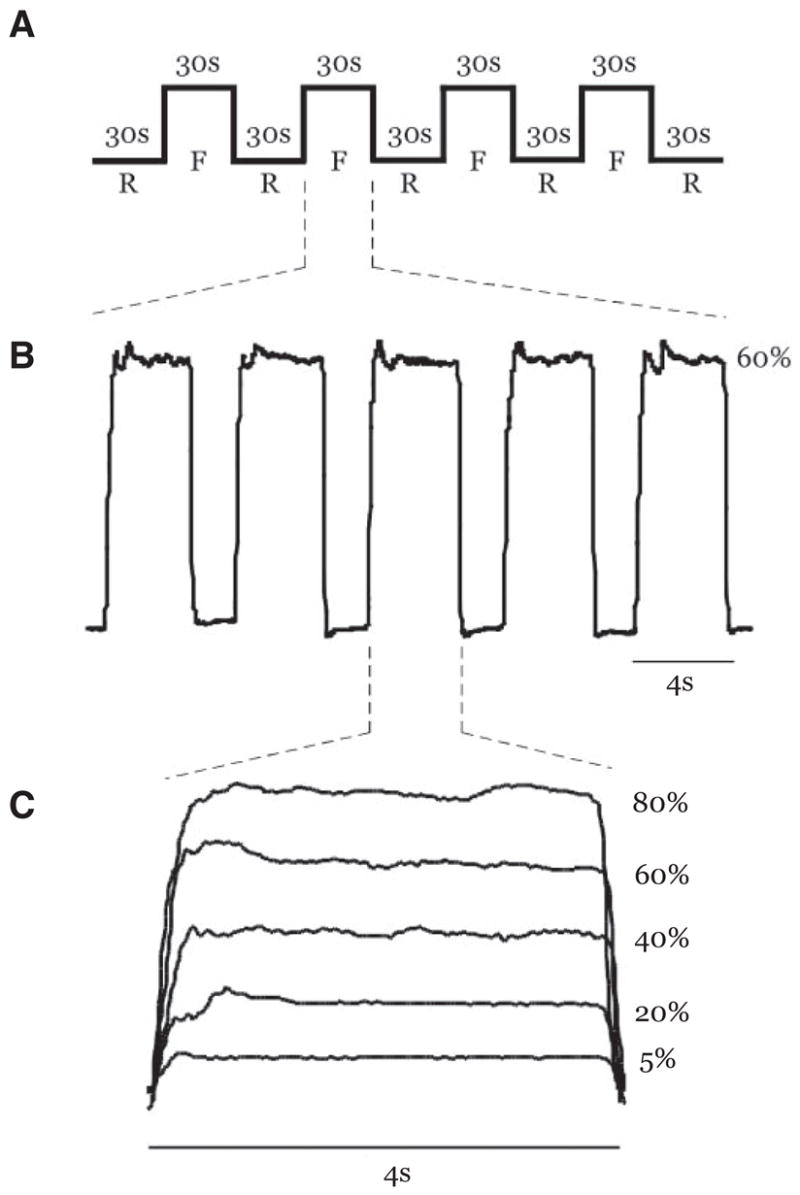
A: schematic description of the task repeated at each force level (F, force blocks; R, rest blocks). B: actual force trace from a single subject during the 60% maximum voluntary contraction (MVC) force level. Five 4 s contractions completed within a single force block are shown. C: actual force trace from a single subject performing a contraction at 5, 20, 40, 60, and 80% MVC during 5 different trials. All contractions were 4 s long.