
Figure 4.
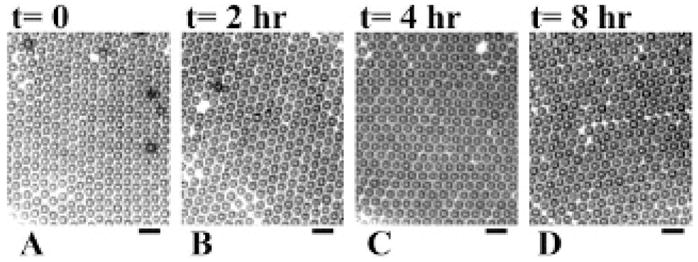
Microscope images of microbubbles recorded at different times illustrating stability: A, t = 0; B, t = 2 hours; C, t = 4 hours; D, t = 8 hours. The microbubbles have a mean diameter of 3.7 μm with a standard deviation of 0.2 μm. The scale bar represents 10 μm.