
Figure 1.
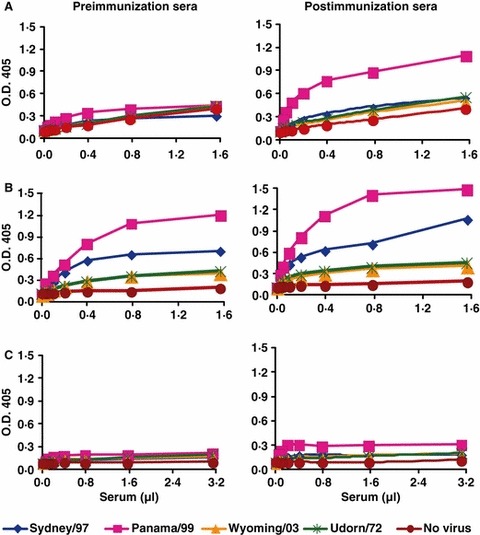
Examples of binding curves showing variable response toward native glycoproteins. The pre‐vaccination and post‐vaccination serum samples from three subjects are shown. In panel (A) the subject has very low pre‐immunization antibody levels and shows a good rise after vaccination. Panel (B) shows a subject with high levels of pre‐immunization antibodies and little increase on vaccination. The subject in panel (C) is a true non‐responder, with a very low level of pre‐immunization antibody and no increase after vaccination.