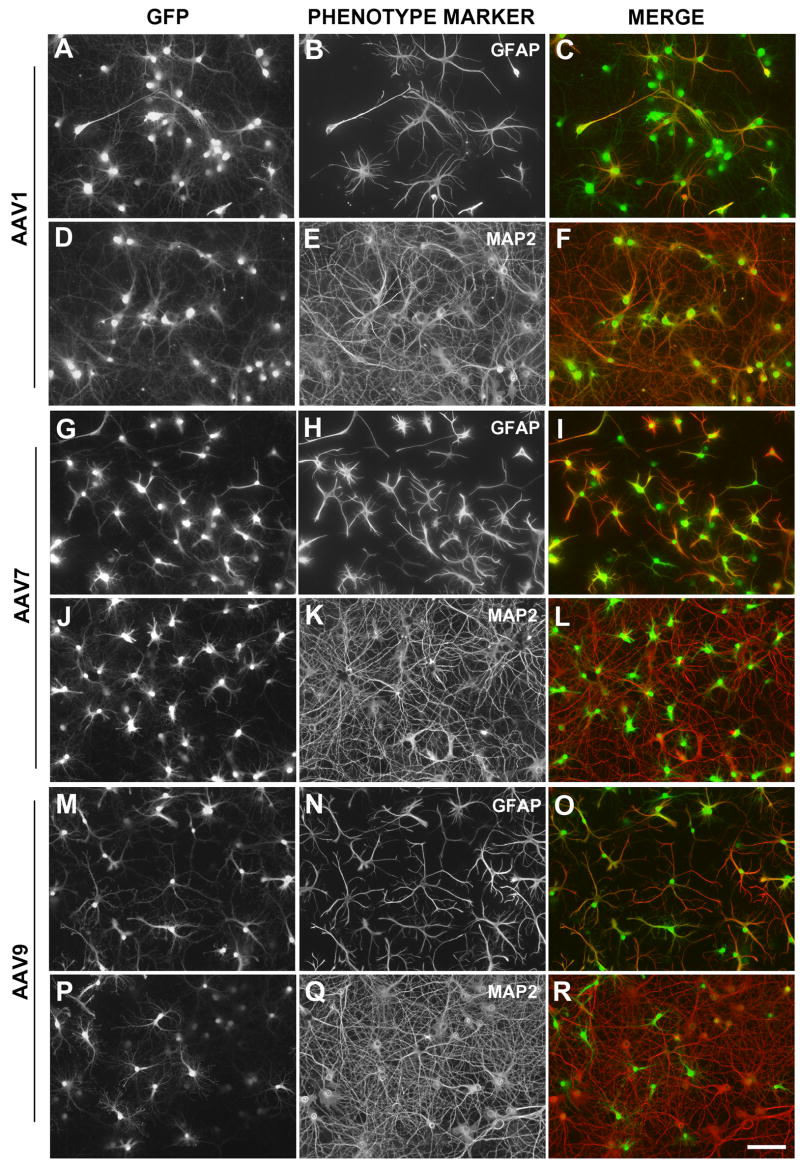
Figure 2.
Expression of GFP in neurons and astrocytes of hippocampal cultures transduced by AAV1 (A-F), AAV7 (G-L), or AAV9 (M-R). GFP expression is shown in the first column (A, D, G, J, M R) and GFAP immunostaining (B, H, N) or MAP2 immunostaining (E, K, Q) in the second column. The third column contains a merged pseudocolored representation of the first two panels in each row. Bar, 100 microns.

