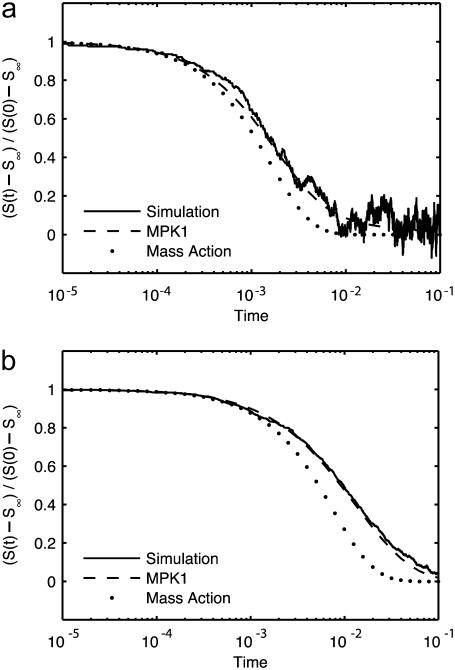
FIGURE 5.
Reaction model conforms with theory for reversible reactions. Survival probability S(t) for a single target A particle in the bimolecular reversible reaction A + B ↔ C, plotted as the normalized deviation from the predicted equilibrium value S∞ = kd/(ka + kd), with DA = DC = 0, DB = cB = 1, ka = 125, and box size 53. Solid lines are simulation results averaged over 1000 repetitions, dashed lines are theoretical predictions calculated according to MPK1 multiparticle kernel theory, and dotted lines are theoretical predictions calculated according to mass action. (a) kd = 500. (b) kd = 5.

