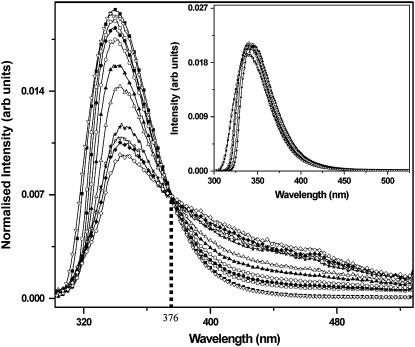
FIGURE 1.
Area-normalized fluorescence emission spectra of serotonin at different concentrations: 60 μM (open inverted triangles), 1 mM (solid squares), 12.5 mM (open squares), 25 mM (solid circles), 50 mM (open circles), 100 mM (solid triangles), 200 mM (open triangles), 300 mM (solid stars), 400 mM (open stars), 500 mM (solid diamonds), and 600 mM (open diamonds). The isoemissive point at 376 nm is shown with the dotted vertical line. (Inset) Simulated area-normalized emission spectra of serotonin taking reabsorption of the emission into account; for 60 μM (open inverted triangles), 1 mM (solid squares), 50 mM (open squares), 100 mM (solid circles), 300 mM (open circles), and 600 mM (solid triangles) serotonin. Reabsorption does not appreciably affect the spectra above 360 nm and does not explain the characteristics of the experimentally measured spectra.

