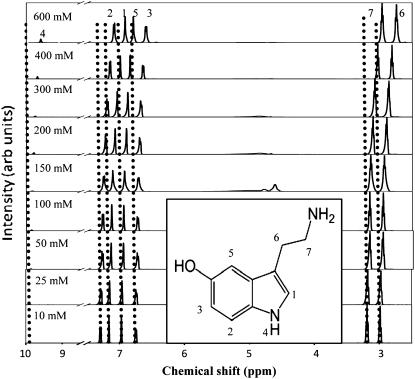
FIGURE 4.
Proton NMR spectra of serotonin as a function of concentration. The dotted vertical lines mark the different proton peak positions for 10 mM serotonin. The amplitude of each spectrum is normalized with respect to proton 7. The numbers on top of each peak (for 600 mM) correspond to specific protons of the serotonin molecule (see inset). (Inset) Chemical structure of the serotonin molecule with different protons marked from 1 to 7.

