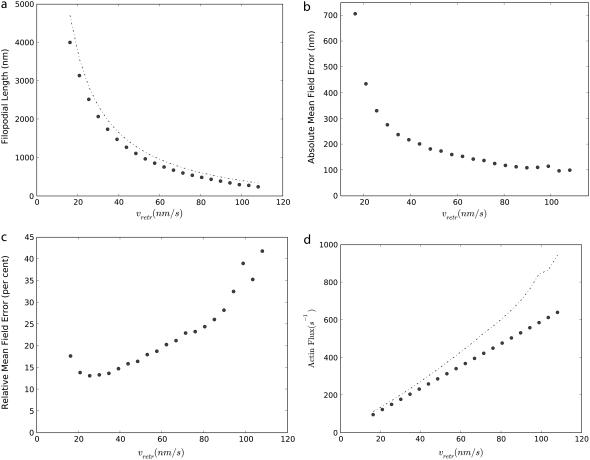
FIGURE 8.
(a) Dependence of the average filopodial equilibrium length, 〈h〉, on the speed of the retrograde flow, vretr, at the pointed end. Circles represent the ensemble average obtained from 1000 Gillespie trajectories, and the dashed line represents the mean field solution (Eq. 17). (b) The absolute mean field error defined as the difference between the mean field and exact solutions. (c) The relative difference between the mean field and exact solutions (absolute error divided by filopodial length). (d) Actin flux computed from stochastic simulations (circles) and the mean field (Eq. 13; dashed line).

