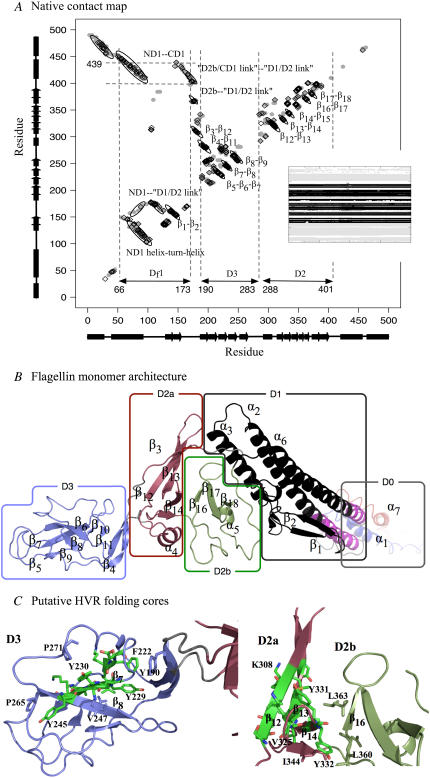
FIGURE 2.
(A) Residue contact map of native flagellin structure. Shaded circles indicate contacts in 1UCU. Black diamonds indicate persistent native contacts: contacts found in >70% of the snapshots taken from the last 1 ns of the control simulation as a monomer in solution. Dotted lines mark location of Df1 contact clusters (see Text). (B) The tertiary structure of flagellin monomer in solution obtained from MD simulation (starting from polymeric flagellin structure) showing DSSP-assigned α-helices and β-strands. Each (sub)domain is colored differently and labeled, with linkers colored gray. N-terminus (blue) and C-terminus (red) helices are disordered in the monomer. We have neglected the very small β-turn from residues 130 to 135 in our labeling scheme. Segment Df1 of D1 is in black, with the remaining portion in magenta. (C) The residues in the HVR domains (D2 and D3) forming persistent pairs of residue contacts in at least two of the five 500 K simulations are shown as sticks and colored by chemical element: carbon (green), oxygen (red), and nitrogen (blue). The β-sheets β6β7β8 and β12β13β14 might form folding cores. Molecular structures are rendered with PyMOL (52).

