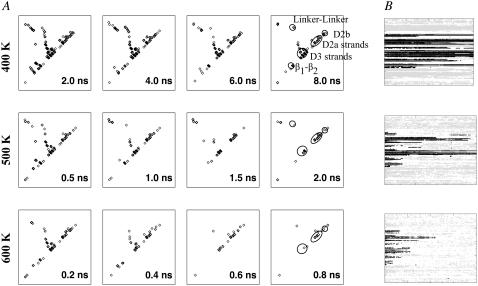
FIGURE 3.
(A) Changes to persistent contact maps from the first set of simulations. Here, only persistent contacts within each time window of 2-ns (400 K), 0.5-ns (500 K), or 0.2-ns (600 K) are plotted. (B) Changes to DSSP assigned secondary structures from the same simulation set (black, β-strand; gray, α-helix), with plot for 300 K shown as inset to Fig. 2. Note that simulation lengths differ: 8-ns (400 K), 6-ns (500 K), and 2-ns (600 K).

