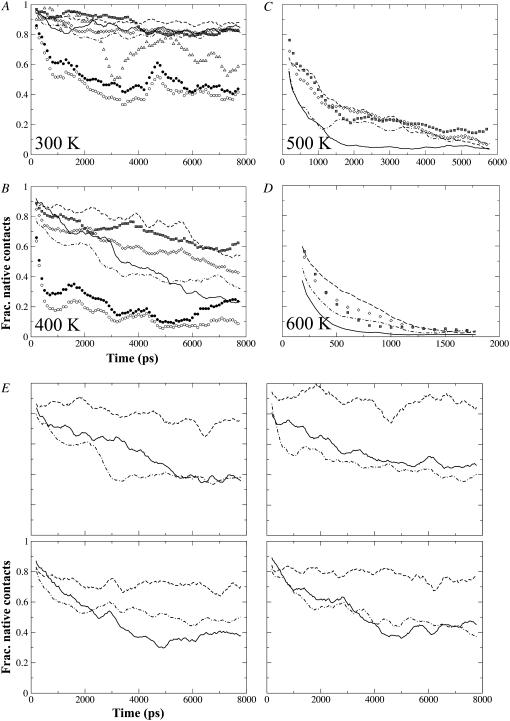
FIGURE 4.
(A–D) Change of normalized fractional contacts of (sub)domains with simulation time, taken from the first set of simulations. Only contacts present in the starting structure were monitored and resulting fractional contacts normalized for better comparison between subdomains: Df1 (thick continuous line), D2 (open diamonds), D2a (dashed line), D2b (dot-dashed line), D3 (hatched squares), ND0 (solid circles), and CD0 (open circles). Note that D0 fractional contacts are shown only for 300 and 400 K. Fractional contacts for D1 excluding Df1 segment are shown only for 300 K (open triangles). (E) Plots from the remaining four 400 K trajectories of 8 ns each, showing only fractional contacts for Df1, D2a, and D2b. Note that abscissa and ordinate for all four plots are the same. In panels A–E, data points for Df1, D2a, and D2b have been resampled at 40-ps interval with a 20-ps window running-average applied for smoothing; for the rest, resampling interval is 100-ps with a 10-ps running-averaging.

