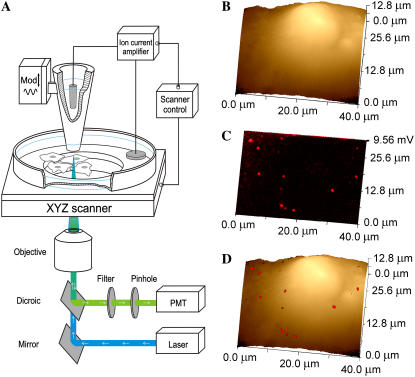
FIGURE 1.
SSCM of VLPs on the surface of a cell membrane. (A) Schematic diagram of the SSCM (not to scale). A conical glass nanopipette is placed over the surface of the cells and aligned with the laser beam and photomultiplier detector for simultaneous topographical and fluorescence measurements while the sample stage scans in XYZ directions. (B) A low-resolution topographical image of a COS7 cell formaldehyde fixed after addition of fluorescently labeled VLPs. (C) Corresponding fluorescence surface confocal image of VLPs obtained simultaneously with topography shown in B. (D) Fluorescent on topography overlay image showing the distribution of VLPs on the surface of the cell detected by fluorescence.

