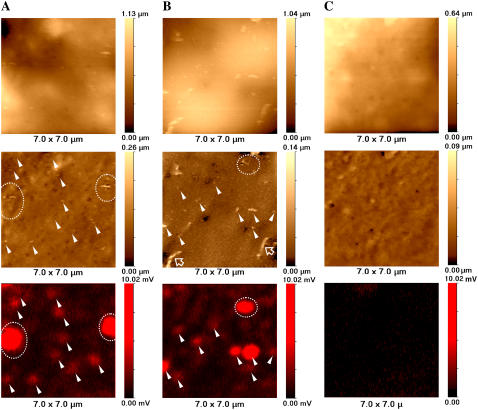
FIGURE 2.
High-resolution SSCM imaging of single VLPs on COS7 cell membranes. (A and B) SSCM images of COS 7 cells fixed immediately after addition of fluorescently labeled polyoma VLPs. (C) Control SSCM images of fixed COS 7 cells (no VLPs added). (Top row) Unprocessed topographical images. (Middle row) Processed (slope-corrected and high-pass-filtered, see Materials and Methods) topographical images. (Bottom row) Fluorescent images of Cy5-labeled VLPs. Matching topographical and fluorescent representations of VLPs are indicated with arrowheads and dashed circles. Hollow arrows point to microvilli.

