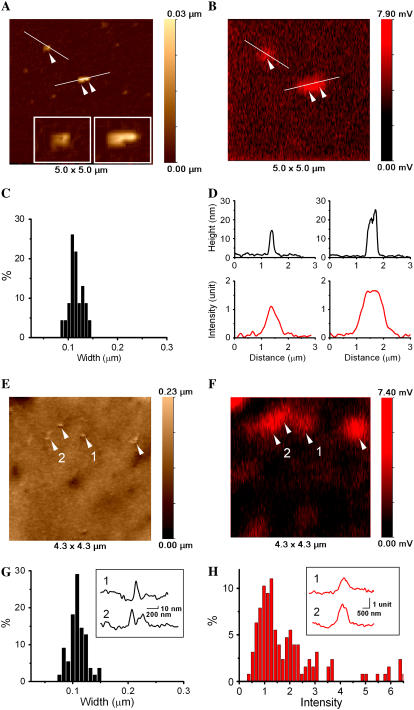
FIGURE 3.
High-resolution SSCM imaging of single VLPs on the surface of glass and on the cell membrane. (A) Topographical image showing single VLPs on glass. Insets show zoom of the corresponding particles (single and pair). (B) Fluorescence image of VLPs on glass acquired simultaneously with topographical image shown in A. (C) VLP width distribution calculated from the topographical images of VLPs on glass (N = 23). (D) Topographical (top row) and fluorescence intensity (bottom row) profiles plotted from A and B, respectively. (E) Topographical image of single VLPs on the cell membrane. (F) Fluorescence images of VLPs on the cell membrane acquired simultaneously with the topographical image shown in E. (G) VLP width distribution calculated from the topographical images of VLPs on cell membrane (N = 57). Inset shows topographical profiles of the corresponding VLPs obtained from E. (H) Fluorescence intensity distribution calculated from SSCM images of VLPs on cell membrane (N = 127). Inset shows fluorescence intensity profiles of the corresponding VLPs obtained from E.

