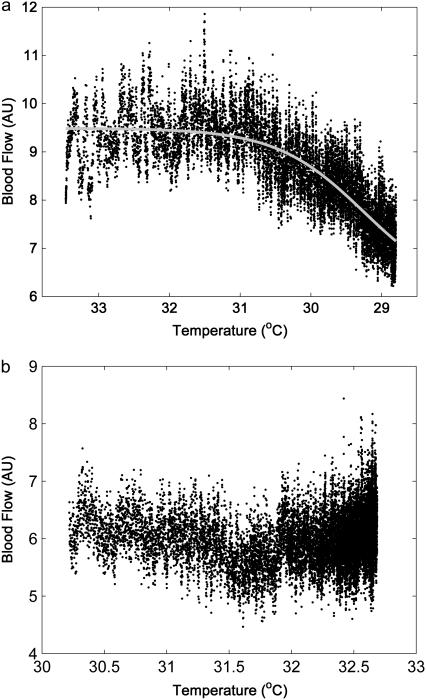
FIGURE 1.
Skin blood flow versus skin temperature during local cooling with an ice pack (a) and recovery period (b), obtained in 10 healthy subjects. Median values of each sample of blood flow across 10 recordings are plotted against corresponding medians of the skin temperature. Sampling rate is 10 Hz.

