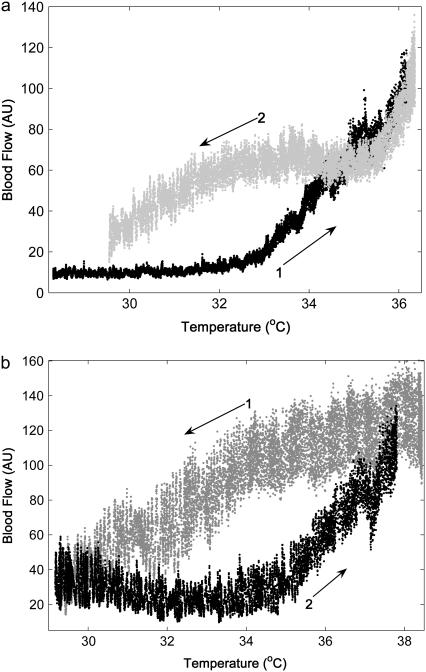
FIGURE 2.
Relationship between blood flow and skin temperature when skin temperature is changed in steps of 1°C/min within a cycle between 24 and 42°C; starting from 24°C (a) and from 42°C (b). Each sample value of blood flow is plotted against the corresponding sample of skin temperature. Sampling rate is 10 Hz.

