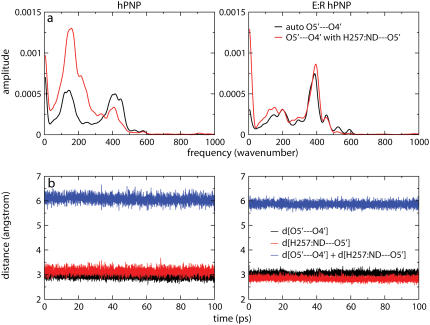
FIGURE 8.
Power spectra of the O5′⋯O4′ distance autocorrelation function and the O5′⋯O4′ and H257:Nδ⋯O5′ distance-distance cross-correlation functions of guanosine and  complexed with hPNP and E:R hPNP (a). The plots show the distance O5′⋯O4′, H257:Nδ⋯O5′, and the summation of two distances throughout the last 100 ps of a 260 ps simulation (b).

