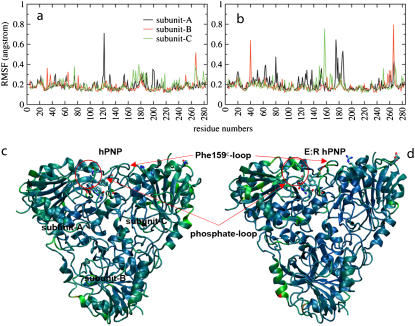
FIGURE 9.
Residue flexibility for backbone atoms of hPNP (a) and E:R hPNP (b). Ribbon diagrams (c and d) are colored on the basis of the relative amplitudes of fluctuations of individual residue for hPNP and E:R hPNP, respectively. A blue-to-red color spectrum is used to represent different levels of flexibilities, where the smallest motions are in blue and the largest are in red. The phosphate-loop and Phe-159C-loop regions are indicated. Structure of ImmG, His-257A, Phe-200A, Tyr-88A, and Phe-159C are shown.

