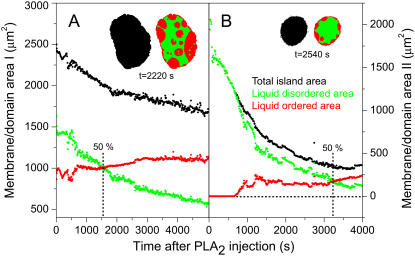
FIGURE 4.
Time-resolved quantification of the total island area as well as areas of the Lo and Ld domains after injection of PLA2 (200 nM) at t = 0 s. Curves in panels A and B are constructed from the image data in Figs. 2 and 3, respectively. Black points denote the total area Atot of the membrane island while green and red points are the areas of the liquid-disordered  and liquid-ordered
  phases within the island. Areas always satisfy the relation
  The inserts show examples of the segmentation of an island into domains. As indicated, data in both panels A and B go through a crossover point corresponding to equal areas of the two domain types.

