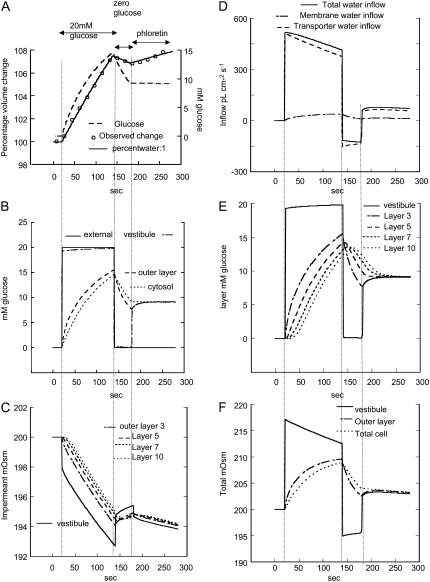
FIGURE 2.
Simulation of effects of 3-OMG flows (20 mM) on water flows in oocytes expressing GLUT2. (A) The simulated oocyte percentage volume change (solid line) is superimposed on the observed data (open circles) obtained by Zeuthen et al. (7). The dashed line shows the simulated average cytosolic glucose concentration mM. The leftmost vertical dotted line indicates the time of isotonic addition of 3-OMG (20 mM). The second vertical line is when 3-OMG is removed and the third vertical line is when phloretin is added. (B) The simulated changes in glucose concentration are illustrated as follows in the external solution (solid line), vestibule (dash-dotted), outer cytosolic layer (long dashed), and averaged inner cytosolic layers (short dashed). (C) The simulated changes in osmolarity of the impermeant solute (KCl) are shown in D, and the rates of fluid inflow via the transporter (long dashed) and via the membrane (short dashed) and the total flow (solid line) are shown. (E) The concentrations of glucose mM in the vestibule and from the most external cytosolic layer, 3, to innermost layer, 10, are shown. (F) The total osmolarity (glucose mM + impermeant solute mOsm) in the vestibule (solid line), outer cytosolic layer, (dash-dotted), and average cytosol (dashed) is shown. (C and D) Outputs from some layers are omitted for clarity.

