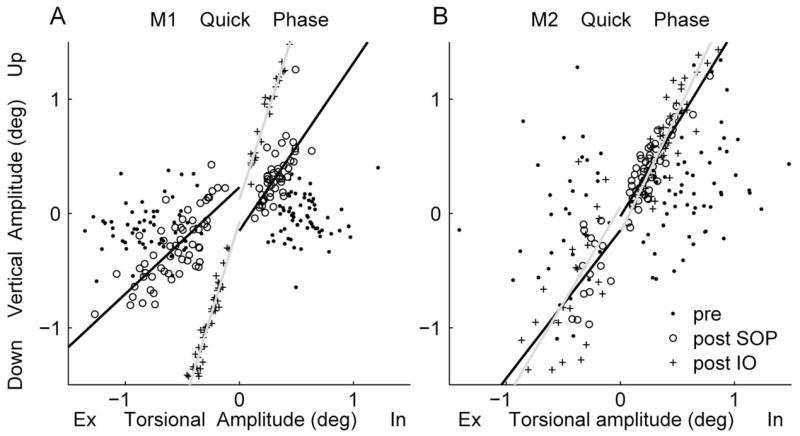
Figure 6.

Linear regression of torsional versus vertical amplitude of quick phases of the PE during PE eye viewing from M1 (A) and M2 (B). In, intorsion; Ex, extorsion. The lines (separated by direction, CW, CCW) are regression equations fitting post-SOP (black line) and post-IO surgery (gray line) data.
