
Figure 3.
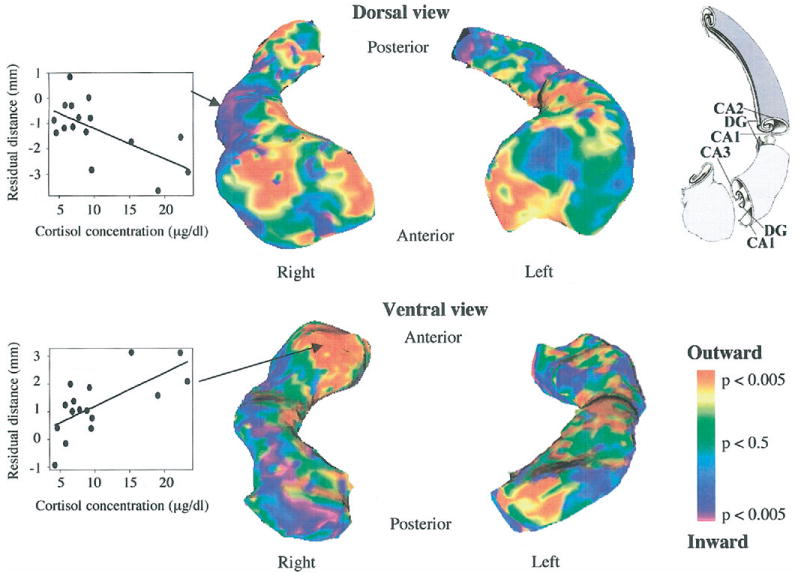
Statistical map showing focal associations between serum cortisol levels and structural alterations of the hippocampus, visualized as significant levels for outward and inward deformations. Scatterplots for two representative surface points are shown for the lateral aspect of the medial segment (inverse association, top) and for the anterior segment (positive association, bottom). The drawing of the internal structure of the hippocampus is adapted with permission from Duvernoy 2005. DG, dentate gyrus; CA1, CA2, CA3, fields of the cornu ammonis.