
FIGURE 5.
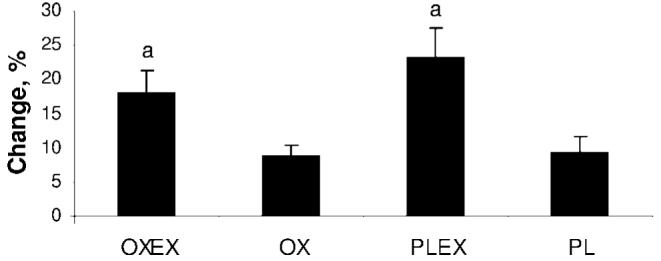
Mean percentage changes in peak aerobic capacity. Data are presented as mean ± SEM. a Peak aerobic capacity, which was significantly improved in both exercise groups, OXEX and PLEX, when compared with OX and PL (P < .05).
Official websites use .gov
A
.gov website belongs to an official
government organization in the United States.
Secure .gov websites use HTTPS
A lock (
) or https:// means you've safely
connected to the .gov website. Share sensitive
information only on official, secure websites.
Mean percentage changes in peak aerobic capacity. Data are presented as mean ± SEM. a Peak aerobic capacity, which was significantly improved in both exercise groups, OXEX and PLEX, when compared with OX and PL (P < .05).