
Figure 2.
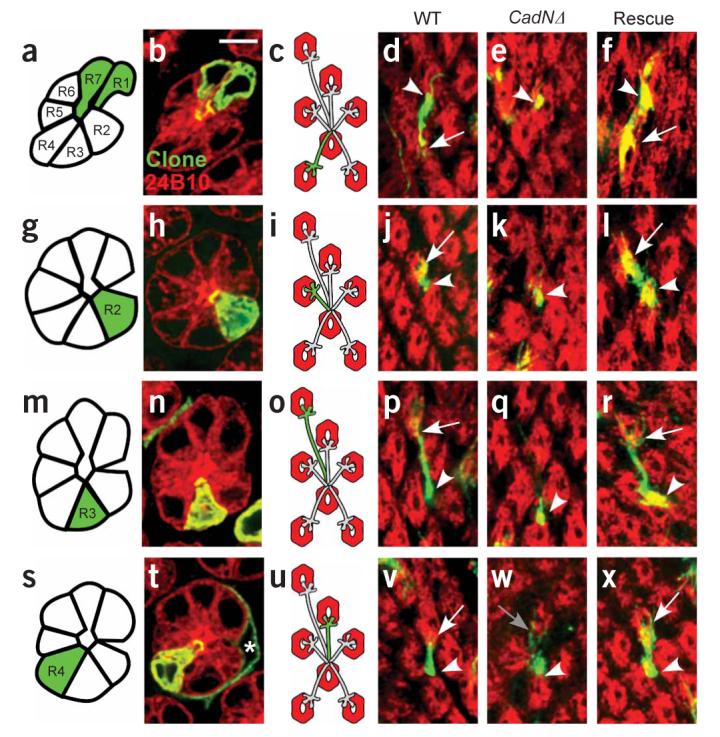
Single-cell MARCM analysis of N-cadherin function in R cells. Each row of the figure corresponds to a single R-cell subtype, and each column to a specific genetic background. (a,g,m,s) Schematic of the retina. Each row contains a single mutant R1–6 cell (green) surrounded by otherwise wild-type neighbors (white). (b,h,n,t) Confocal images of single ommatidia with one R1–6 cell labeled. These images were collected using a pan–R cell marker (red) and a marker specific to each mutant cell (green). (c,i,o,u) Schematic representation of labeled R-cell axons. (d–f,j–l,p–r,v–x) Confocal images of single R-cell axons. Single mutant R cells are green, whereas target cartridges containing all other R-cell axons are labeled red. a–f, R1. g–l, R2. m–r, R3. s–x, R4. a–d, g–j,m–p,s–v: wild type (WT). e,k,q,w: CadNΔ mutant R-cell axons. f,l,r,x: CadNΔ mutant R cells expressing a single isoform of N-cadherin, denoted ‘Rescue’. Arrowheads mark the start of each axon extension; arrows mark the end. Panel w shows an R4 axon that makes an aberrant extension of a few filopodia (gray arrow). Scale bar, 5 μm.