
Fig. 3. Glial modulation of light-evoked spiking in rat ganglion cells.
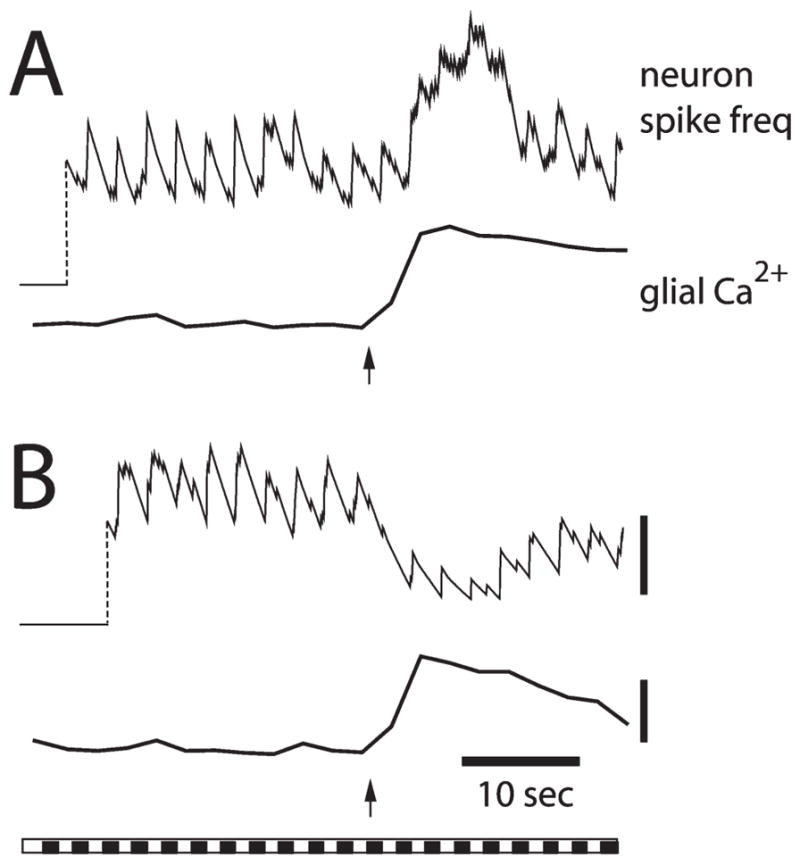
Facilitation of neuron spiking (A) and depression of spiking (B) are illustrated in recordings from two ganglion cells. A frequency plot of spike activity (top trace) and Ca2+ levels in glial cells adjacent to the neuron (bottom trace) are shown for each trial. Arrows indicate initiation of the glial Ca2+ wave. The bar at the bottom shows the repetitive light stimulus that evokes neuronal spiking. Calibration bars; 3 spikes second−1; 20% ΔF/F. Modified from Newman and Zahs (1998).