
Figure 2.
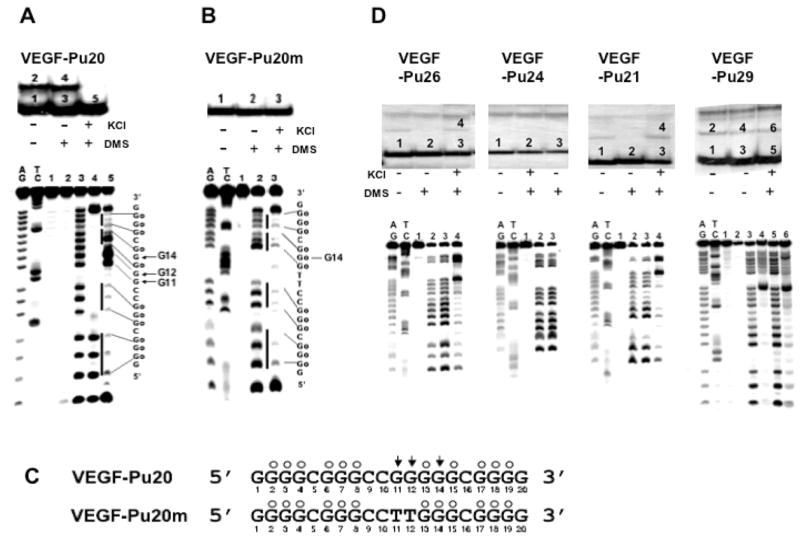
Determination of the intramolecular G-quadruplex structures formed by the G-rich sequence of the VEGF promoter region in the presence of 100 mM KCl. (A) Top, EMSA of VEGF-Pu20 pre-incubated under the conditions specified in the figure using 16% native polyacrylamide gel. Bottom, DMS footprinting of each band (1–5) from EMSA. AG and TC are the sequencing lanes, and lanes 1–5 correspond to the bands from EMSA. (B) Top, EMSA of VEGF-Pu20m pre-incubated under the conditions specified in the figure using 16% native polyacrylamide gel. Bottom, DMS footprinting of each band (1–3) from EMSA. AG and TC are the sequencing lanes, and lanes 1–3 correspond to the bands from EMSA. The vertical bars to the left of lane 5 (Fig. 2A) and lane 3 (Fig. 2B) correspond to DMS protected guanine repeats, and the sequence to the right shows the protected guanines (Go). (C) Summary of DMS footprinting of VEGF-Pu20 and VEGF-Pu20m in the presence of 100 mM KCl. The protected guanines from DMS are indicated by open circles, and guanine residues hypermethylated by DMS are indicated by arrowheads. (D) Determination of the structures of G-quadruplexes formed from VEGF-Pu29, Pu26, Pu24, and Pu21 in the presence of 100 mM KCl. Top, EMSA of VEGF-Pu26, Pu24, Pu21, and Pu29 (left to right) pre-incubated under the conditions specified in the figure using 16% native polyacrylamide gel. Bottom, DMS footprinting of each band from EMSA. AG and TC are the sequencing lanes, and each lane corresponds to the bands from corresponding EMSA.