
Fig. 2.
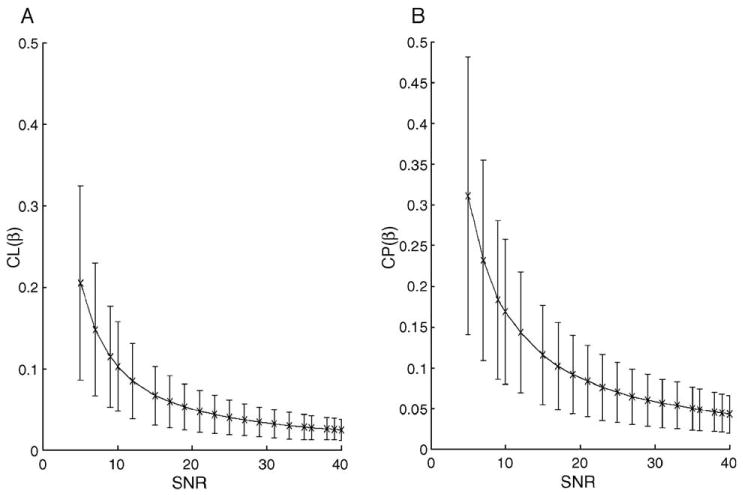
Results from a simulation study of evaluating and under the null hypotheses. Panels (A) and (B) show the mean value and the standard deviation of and as a function of SNR based on 10,000 simulated data sets. (A) Twenty differing SNRs, from 5 to 40, were evaluated. The DT was specified as λ1 = λ1 = 0.84 and λ3 = 0.42, and the true value of CL(β) equaled zero. (B) The DT was specified as λ1 = 0.9 and λ3 = λ2 = 0.6, and the true value of CP(β) equaled zero.