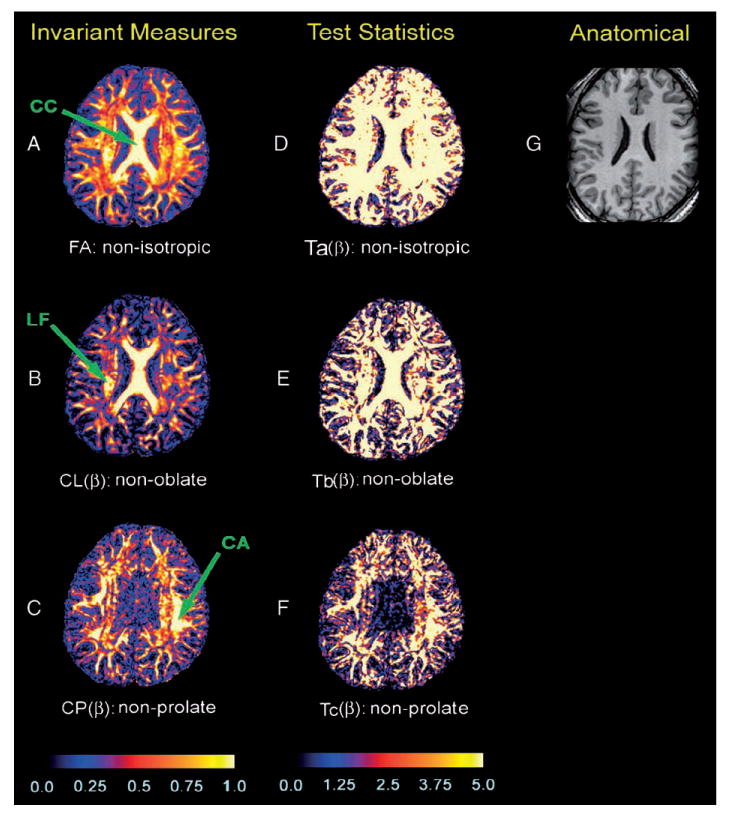
Fig. 3.

Maps of the invariant measures and −log10(P) values associated with test statistics in a single subject. Shown here is an axial slice through the dorsal aspect of the body of the caudate nucleus and the body of the corpus callosum. (A) FA values depicting the degree anisotropy in each voxel. (B) values depicting the degree of nonoblate morphology in each voxel. (C) values representing the degree of nonprolate shape in each voxel; the color bar denotes differences between brain regions in the value of invariant measures. The scale of the color coding ranges from 0 to 1, with black representing the lowest value (0) and white representing the highest value (1). (D) The −log10(P) values of test statistic: . (E) The −log10(P) values of test statistic: Tb(β). (F) The −log10(P) values of test statistic: . The color scale reflects the size of the values of −log10(P), with black to blue representing smaller values (0–1), and red to white representing higher values (1.88–5). (G) The corresponding slice of the T1-weighted anatomical image. CC = corpus callosum; LF = longitudinal fasciculi; CA = cortical association fibers.
