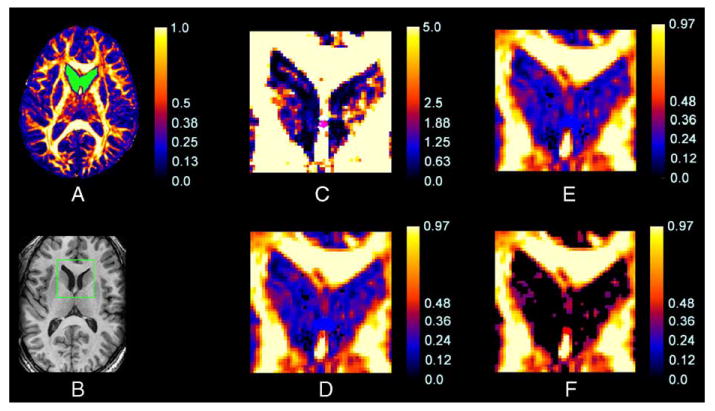
Fig. 4.

A comparison of the information provided by the map of FA values and the corresponding map of −log10(P) values for . Shown here are maps from a single subject in an axial slice at the level of the fornix, genu of the internal capsule, and head of the caudate nucleus. (A) An FA map with the ROI highlighted in green. (B) The corresponding anatomical T1-weighted image of this slice, with a rectangular box indicating the portion of the image magnified in panels (C) through (F). (C) The map of −log10(P) values for in the ROI. The color scale reflects the magnitudes of values of −log10(P), with black to blue representing smaller values (0–1) and red to white representing larger values (1.88–5). (D) The FA map within the ROI. The green circle identifies a voxel on a narrow bridge of tissue in the septum pellucidum that appears as anisotropic in the −log10(P) map (C) but does not appear anisotropic in this FA map. (E and F) The FA maps within the ROI masked by FA thresholds of 0.10 and 0.20, respectively. The color bar denotes the values of FA, with black to blue representing smaller values (0–0.20) and red to white representing larger values (0.4–1). Voxels in the head of the caudate nucleus are incorrectly classified as having degrees of anisotropy similar to CSF using each FA threshold, whereas the −log10(P) map discriminates these two types of tissue successfully in (C).
