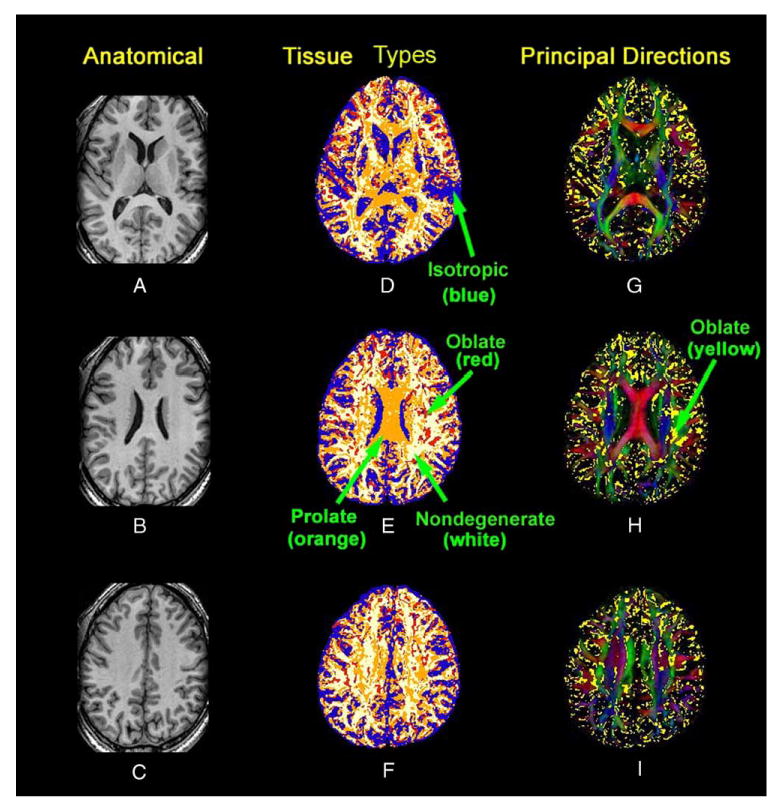
Fig. 6.

Maps of tissue types and the weighted PD in three slices from a single subject. Rows from top to bottom show slices from progressively more dorsal axial slices. (A–C) The T1 weighted anatomical images. (D–F) Maps of tissue types: white = nondegenerate DTs; red = oblate DTs; yellow = prolate DTs; blue = isotropic DTs. (G–I) Principal direction maps: yellow = overlay indicating DTs having an oblate shape.
