
Fig. 2.
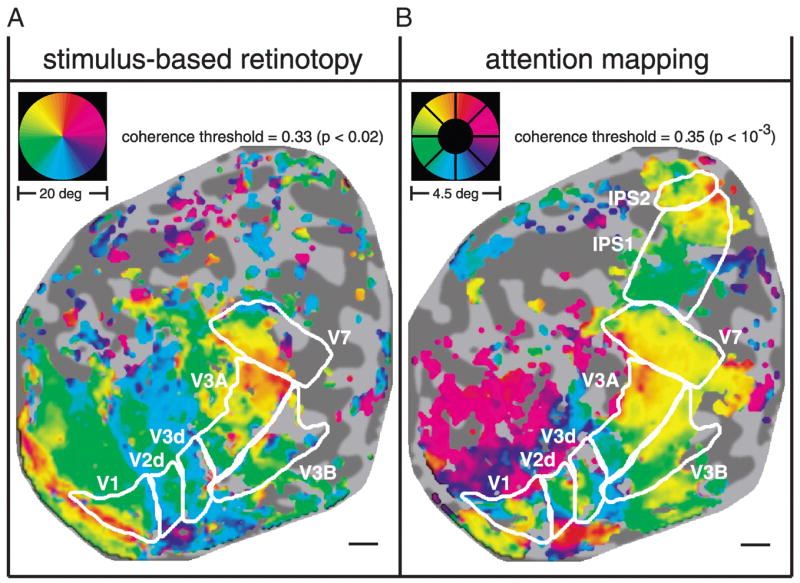
Correspondence between stimulus-based retinotopic and attention-related maps. A: angular component of retinotopic maps, measured using conventional visual stimulation (see RESULTS for details). Gray scale: flattened representation of cortical anatomy corresponding to occipital and parietal cortex (subject MAS, right hemisphere). Dark shading corresponds to sulci and lighter shading to gyri. Color: fMRI response phase. Color wheel inset: corresponding angular position in the visual field. Colors are displayed for all gray matter locations that exceeded the indicated coherence threshold. For each panel, the P value corresponding to the coherence threshold (see METHODS) is also shown. Scale bar, about 1 cm. B: attention-related maps (same format as A). Indicated visual areas V1 through V7 were defined using stimulus-based retino-topic mapping, i.e., copied from A. In addition, there are two additional cortical maps, labeled IPS1 and IPS2, that are not evident in the stimulus-evoked retinotopic maps.