
Fig. 7.
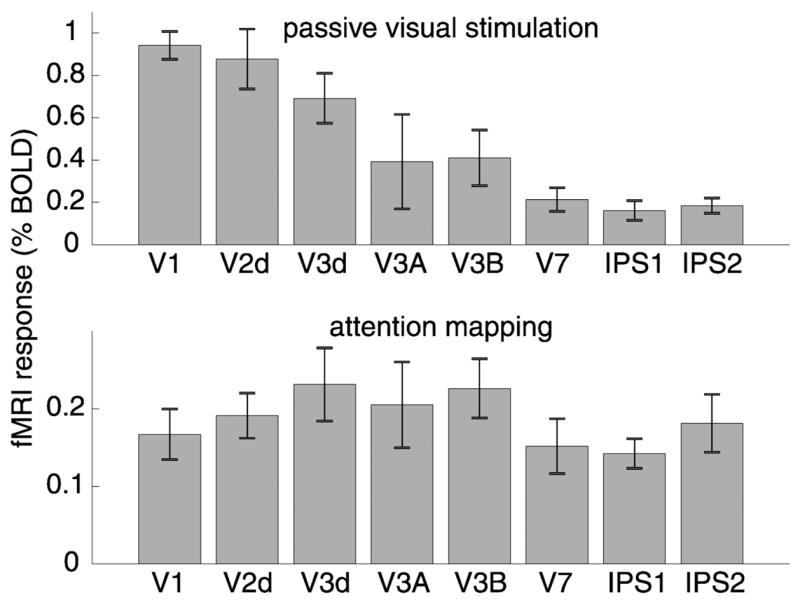
Responses to passive visual stimulation and attention. A: fMRI response amplitudes to passive visual stimulation with a high-contrast visual stimulus. B: fMRI response amplitudes during performance of the attention-mapping task (with very low-contrast visual stimuli). For a given cortical area, the response amplitudes were computed for each subject and then averaged across subjects (n = 4). Error bars: SE.