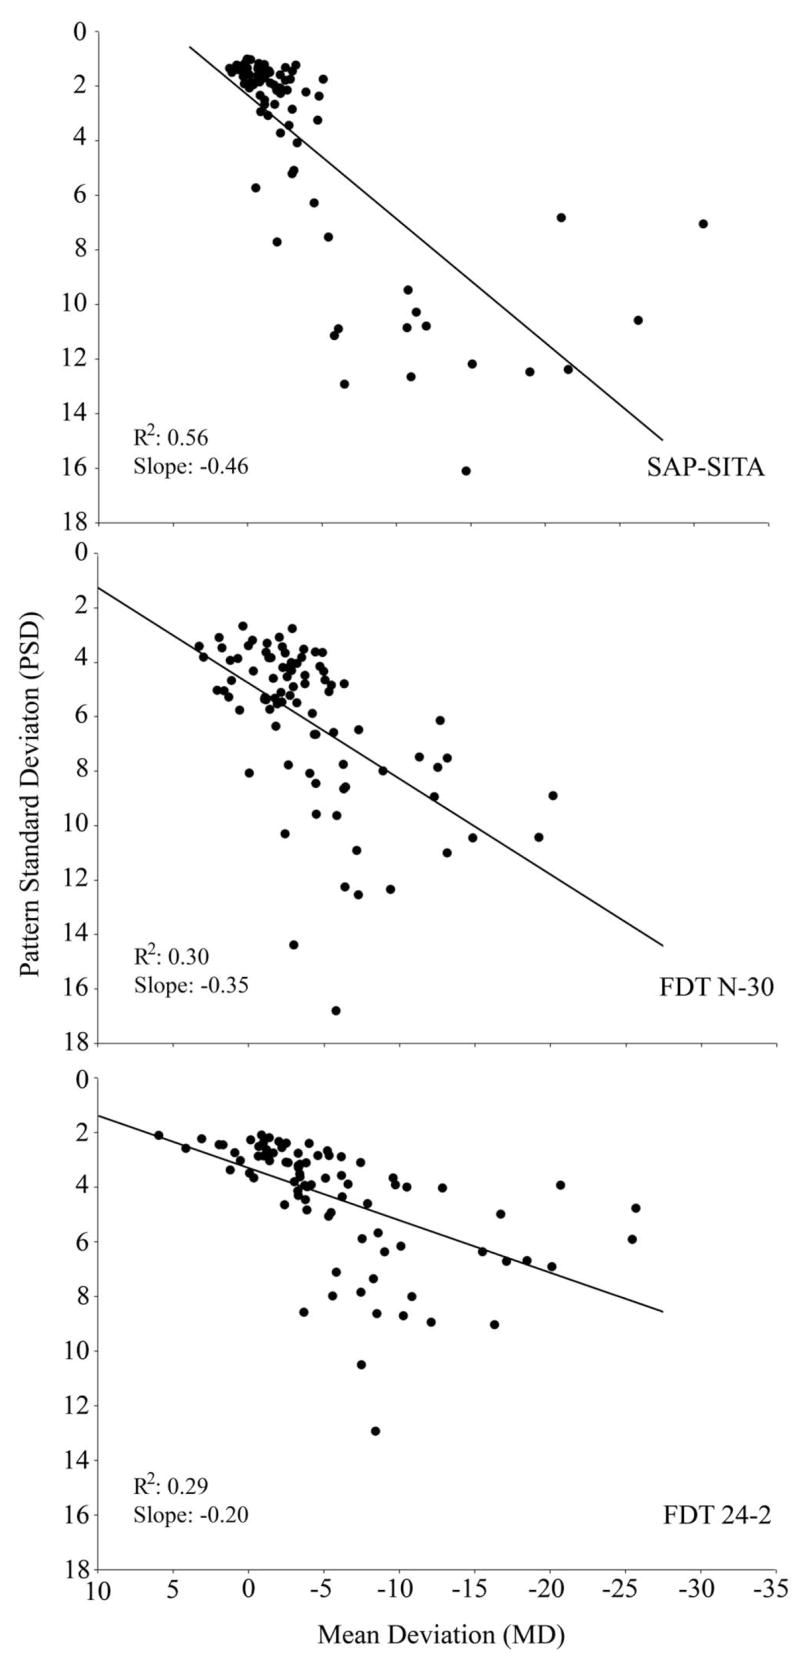
Figure 5.

Scatter plots showing the relationship between the mean deviation (MD) and pattern standard deviation (PSD) for the glaucoma patients (n = 85) for SAP-SITA, FDT N-30, and FDT 24-2.

Scatter plots showing the relationship between the mean deviation (MD) and pattern standard deviation (PSD) for the glaucoma patients (n = 85) for SAP-SITA, FDT N-30, and FDT 24-2.