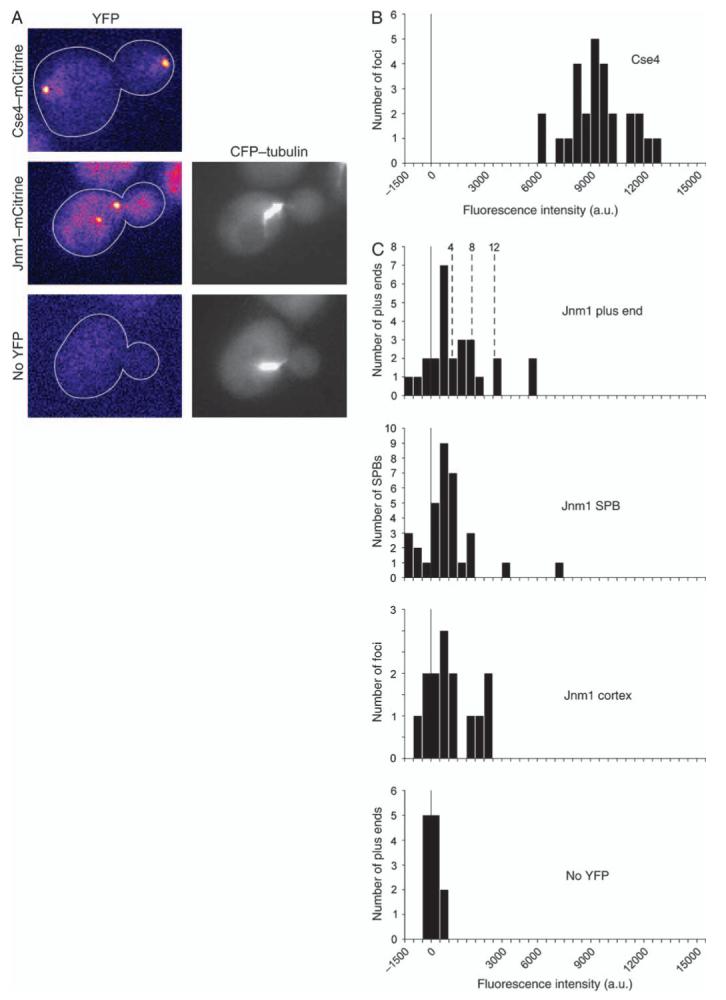
Figure 3. Quantification of dynamitin fluorescence intensity.

A) Representative images of cells expressing Cse4-mCitrine, Jnm1m-Citrine or CFP-Tub1. Yellow fluorescent protein images were captured using identical settings and pseudocolored with the Fire lookup table in ImageJ. B) Histogram of fluorescence intensity per focus of Cse4-mCitrine in anaphase cells. Thirty-two molecules of Cse4 are present in each spot in late anaphase (28), so the fluorescence intensity per molecule of mCitrine here is 295 arbitrary units (au). C) Histogram of fluorescence intensity of Jnm1-mCitrine in budded cells. Some values are less than zero because of background subtraction. Bud-proximal microtubule plus ends (n = 26) and SPBs (n = 33) were identified using CFP-Tub1. Dashed lines indicate the predicted fluorescence intensities for 4, 8 and 12 molecules of Jnm1-mCitrine. Cortical foci of Jnm1-mCitrine were identified by eye (n = 14). The bottom panel is a control with budded cells expressing CFP-Tub1 and no mCitrine. Here, microtubule plus ends were identified in the CFP channel, and intensity was recorded in the mCitrine channel, n = 12. Strain numbers: Cse4-mCitrine, yJC5463; Jnm1-mCitrine CFP-Tub1, yJC5349 and CFP-Tub1, yJC3883.
