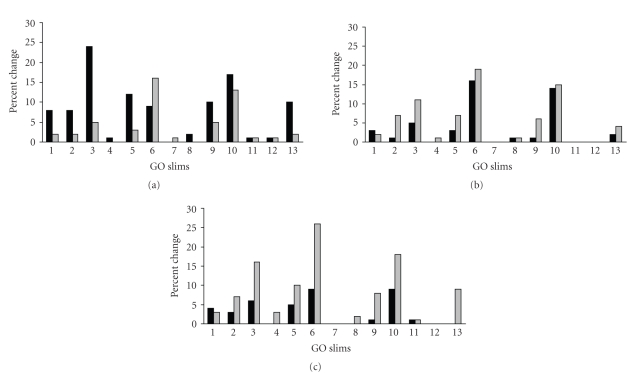
Figure 2.
Overall trends in protein expression in GO Slims common to sub-MICs. For each GO Slim, the percentage of proteins whose expression was either up (black bars) or down regulated (gray bars) is compared to the total entities in that GO Slim are shown for amoxicillin (a), chlortetracycline (b), and enrofloxacin (c). GO Slim categories are as follows: 1, external encapsulating structure; 2, DNA metabolism; 3, nucleobase, nucleoside, nucleotide, and nucleic acid metabolism; 4, protein metabolism; 5, transcription; 6, protein biosynthesis; 7, response to stress; 8, carbohydrate metabolism; 9, catabolism; 10, structure molecule activity; 11, peptidase activity; 12, amino acid derivative metabolism; 13, generation of precursor metabolites and energy.

