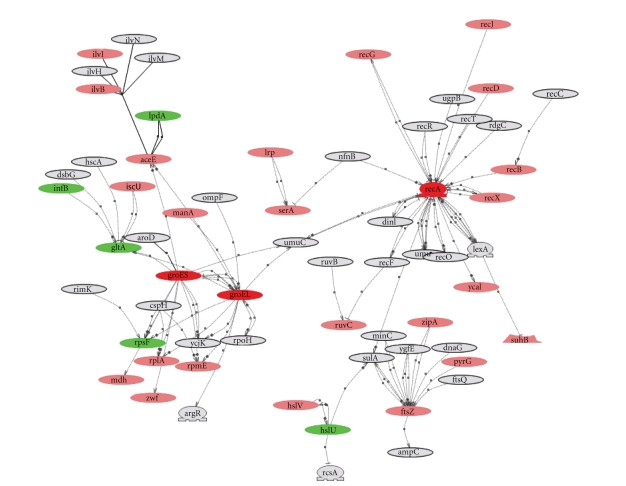
Figure 3.
P. multocida RecA protein interaction network. P. multocida sub-MIC ENR response was marked by significant change in RecA expression. We built interaction network iteratively with RecA as primer and identified RecA, GroEL, and GroES subnetwork. Red nodes are proteins with increased expression and green nodes are proteins with decreased expression in response to ENR. Proteins with no significant changes in expression are shown in pink, and gray nodes are proteins from P. multocida interaction network that were not identified in our dataset.

