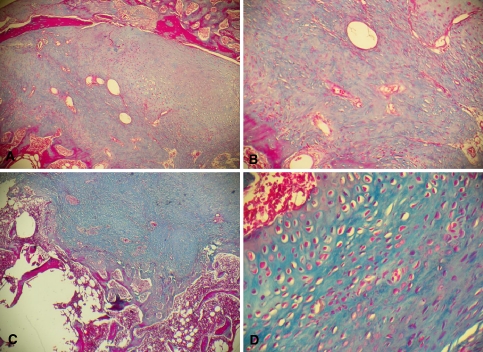
Fig. 8.
Photomicrograph of the interface of the decorticated group with a cortical graft (group II). Note the predominant model of intramembranous ossification. a Section from an animal killed 3 weeks after surgery. Note the marked neoformation of compact bone in the entire interface (Masson trichrome, ×40). b Same section as in a at higher magnification. Note the direct formation of irregularly distributed osteoblasts and the large quantity of blood vessels (Masson trichrome, ×100). c Section from an animal killed 6 weeks after surgery. Note the presence of large amounts of neoformed compact bone and an area of bone remodeling (Masson trichrome, ×40). d Section from an animal killed 9 weeks after surgery. Note the presence of osteoblasts distributed in an orderly manner around the blood vessel and of osteoblasts and osteocytes irregularly distributed in the rest of the histological section (Masson trichrome, ×100)

